Flow Builder
Flow Builder is an editor that allows you to create interactive communication flows with minimal programming or scripting efforts. It has an easy-to-use drag and drop interface called 'Flow Canvas' that allows you to build communication flows using 'Nodes'. The communication logic is built on a flow canvas by connecting and configuring nodes in a logical order. A node contains complete information such as initiation, execution, error-handling, condition, notifications, logic - switch statements, and decision logic required to automate complex processes.
A service has one or more flows associated with it, these flows are triggered by rules defined in the service, there can be multiple rules defined, to trigger a flow.
Benefits of using Flow Builder:
- A flow can have simple validations and expressions.
- A flow can be grouped for better design control and usability.
- A flow can be invoked using a rule within a service.
- A flows can be replicated to create a new flow.
There are two types of flows
- Flow
- Voiceflow
List of nodes under each flow.
Flow Builder Interface
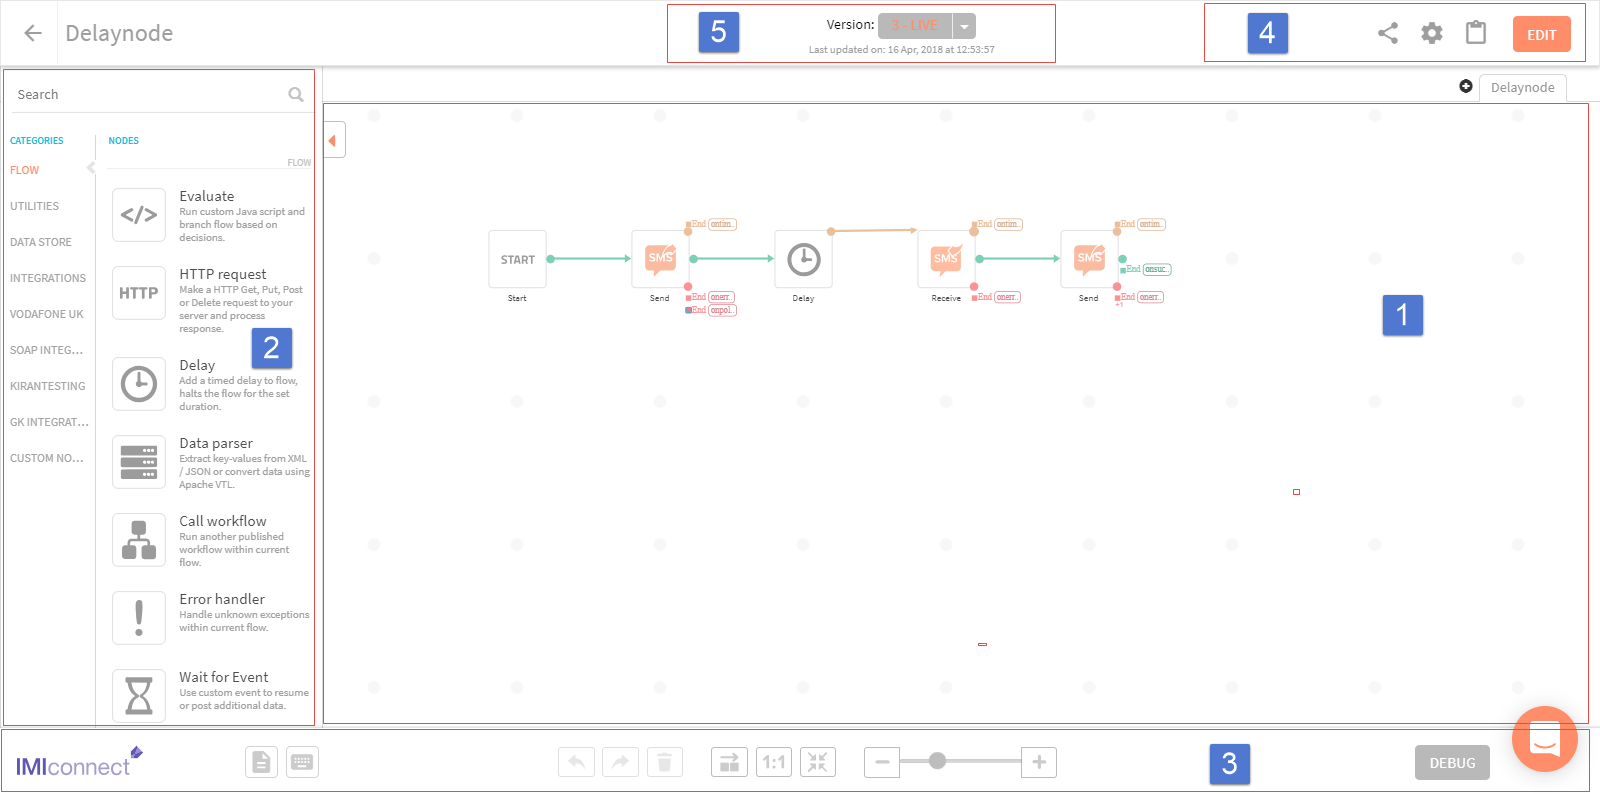
Flow Builder Interface is an interactive, easy-to-use interface to build and manage communication flows in simple steps via intuitive drag-and-drop configurable nodes.
The User Interface(UI) has the following sections:

Feature | Description |
|---|---|
| This is the region where you can build and configure a flow. The flow canvas allows you to drag and drop nodes from the Nodes Palette and connect node using connectors to build a flow |
| It contains all available 'Nodes'. Drag and drop a node into the flow canvas to use it. For more information, see Nodes Catagories: Nodes are categorised into groups based on their usability. When you click a node category, nodes of the selected category are displayed.
SearchBar: Allows you to search a node from the list of available nodes. You can see the nodes displayed, as you type in the search box. For more information on connectors, see Connectors |
| Contain tools to manage the flow, nodes and the activities on flow canvas.
|
|
|
| Displays the current version and state of flow. Click to view the version of the flow. For more information, see Flow Versioning |
Toolbar
The toolbar contains buttons to manage the nodes and flow on the flow canvas.

[](createGroup-Create a group from a selection or two or mode nodes.SAVE-Saves the current flow. Upon saving, if any issues with the flow are encountered, they are reported in the ERRORS AND WARNINGS area.)
| Toolbar button | Description |
|---|---|
| Undo | A multi-level undo that reverses an action and its relative effect. |
| Redo | A multi-level redo that will undo a previous action. |
| Delete | Deletes a selected node or a connector. |
| Auto arrange | For better visibility, all the nodes in the flow are arranged in an order from left to right with equal distance between each node.For example, a node that is invoked in the final stage will be moved to end of the flow (extreme right.). For more information, see Configuring Events |
| Actual Size | Resets to default canvas size (from zoom in/out level) |
| Fit to screen | Flow canvas gets refreshed and the whole flow with all the nodes is display in the flow canvas. |
| Zoom in | Magnify the canvas. |
| Zoom out | Shrink the canvas. |
Session Parameters
When you double-click a node, a configuration window pops up with various configuration tabs that allow you to define and configure 'Session Parameters' and 'Custom Log IDs.'
By default, a predefined set of session parameters covering popular channel attributes are available, however, you can add custom variables to address flow requirements. These parameters can be subsequently accessed within each node either to retrieve or assign a value.
Custom Logs
Custom logs can be accessed within each node to log the state of session parameters
For more information, see Defining Session Data and Custom Logs
[](Global Session Data - Used to define global session parameters.)
[](CompileFlow - Used to compile a voice flow before using it in rules or flows. This option is not applicable for Flow.)
Nodes
A Node is a discrete function that executes in a flow. These nodes are based on their configurable properties are classified into different categories for easy identification and navigation. You can drag and drop nodes to place them on the flow canvas, the node snaps to canvas-gride. You can drag a node to any position on the canvas gride that is free, however, you cannot place a node vertical (over and under) to a node.
Nodes are connected in a logical sequence using connectors to form a flow. Each node comes with specific configurable properties. Double-click to open a node and supply it with appropriate data to configure it.
Nodes encapsulate an action or a decision to form the basis of a flow. Each node performs a specific function, and in some cases depending on the outcome, can decide between two possible paths to continue. For a flow to work, a node must be connected to other nodes using connectors and configure the events.
There are three elements of a node, a node accepts input, provides output and setting to configure the events that node has to perform. When you delete a node in a flow, the successive connectors (event nodes) are also deleted and there might be a need to reconstruct the flow.
- All node comes with predefined edges, except the 'Evaluate' node.
- A node edge can be connected to another node with a connector.
- A node edge is used to end the flow, by configuring the 'End Flow Setting'
Node Events
A node event is a possible outcome of a node. Depending on the data supplied, a node can have one or more outcomes. Events of a node are either connected to the next node or configured to terminate the flow.
Node Events in a node helps to define and configure possible outcomes of an event. By default, the node event tab lists the possible outcome of that particular node, you can define a node event and assign a result label.
To view Node Events of a Node
- Select and double-click a node to open the node configuration window
- Click NODE EVENTS tab to see the list of node events.
Connectors
Connections are made using connectors within the nodes. Connectors appear when you point, hold and drag a node edge towards a target node (except the Start node, as it does not accept inputs). When you are about to connect an event to the target node, the target node is highlighted. A dotted line appears till you connect the event. After the event is connected, the dotted line turns into a continuous line.
Working with Error and Warnings
When you save a flow, it might be incomplete or have errors. When you attempt to save incomplete flows, errors are generated and listed under ERROR & WARNING pane, at the right side of the flow canvas. Most of the errors and warnings are self-explanatory, hence you can address the errors by editing the flow.
Errors and Warnings are generated under the following context,
- When you save an incomplete flow.
- When a mandatory parameter is left incomplete in a flow.
- When a node edge is left unassigned.
- When a connector is incomplete.
Debug
The Debug feature in a flow details the execution and transactional details. It helps you to view the sequence of activities in a node and progress of the flow. You can search and filter a transaction log using the search feature.
Debug panel displays following details of each flow execution:
-
A list of most recent transaction logs of the flow.
-
Option to drill down into details of each Transaction by clicking on the Transaction ID.
-
Date and Timestamp of a given transaction. You can filter the logs based on selected date range and day ( Logs are available for the latest 30 days)
-
Duration: Total time the system has taken to execute the request in milliseconds.
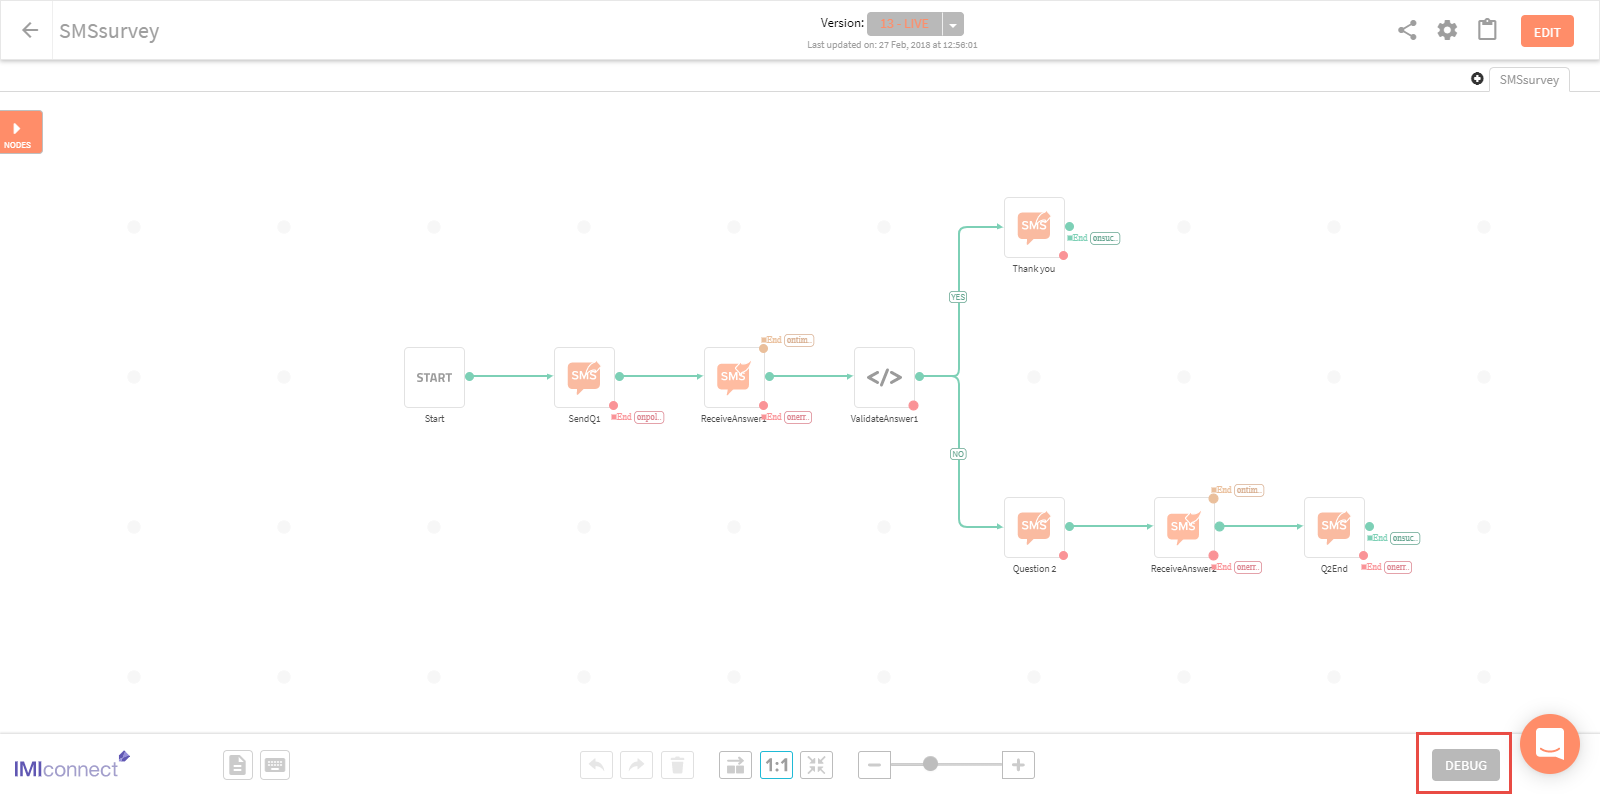
The DEBUG button is present at the right bottom of the flow canvas.

Click Debug to open the split window.

Important considerations
- Ensure to save and make the flow live before executing the flow.
- Most recent 10 transactions are listed, however, you can use the timestamp to view transactions up to 30 days.
- Click on a transaction sequence to view(drill down) the details of each flow.
Using Debug Feature
You can make use of the Debug feature to view the Flow sequence, look out for error or unexpected behavior and transaction details of each Node.
- Search/Locate the service on the services dashboard.
- Click on the service you want to debug.
- On the setting panel, click Flows.
All the flows are displayed in the flow list. - Choose the flow you want to Debug, click the corresponding MANAGE button and select EDIT.
The Flow canvas opens in full view mode. - Click Debug button available at the bottom right corner of the flow canvas.
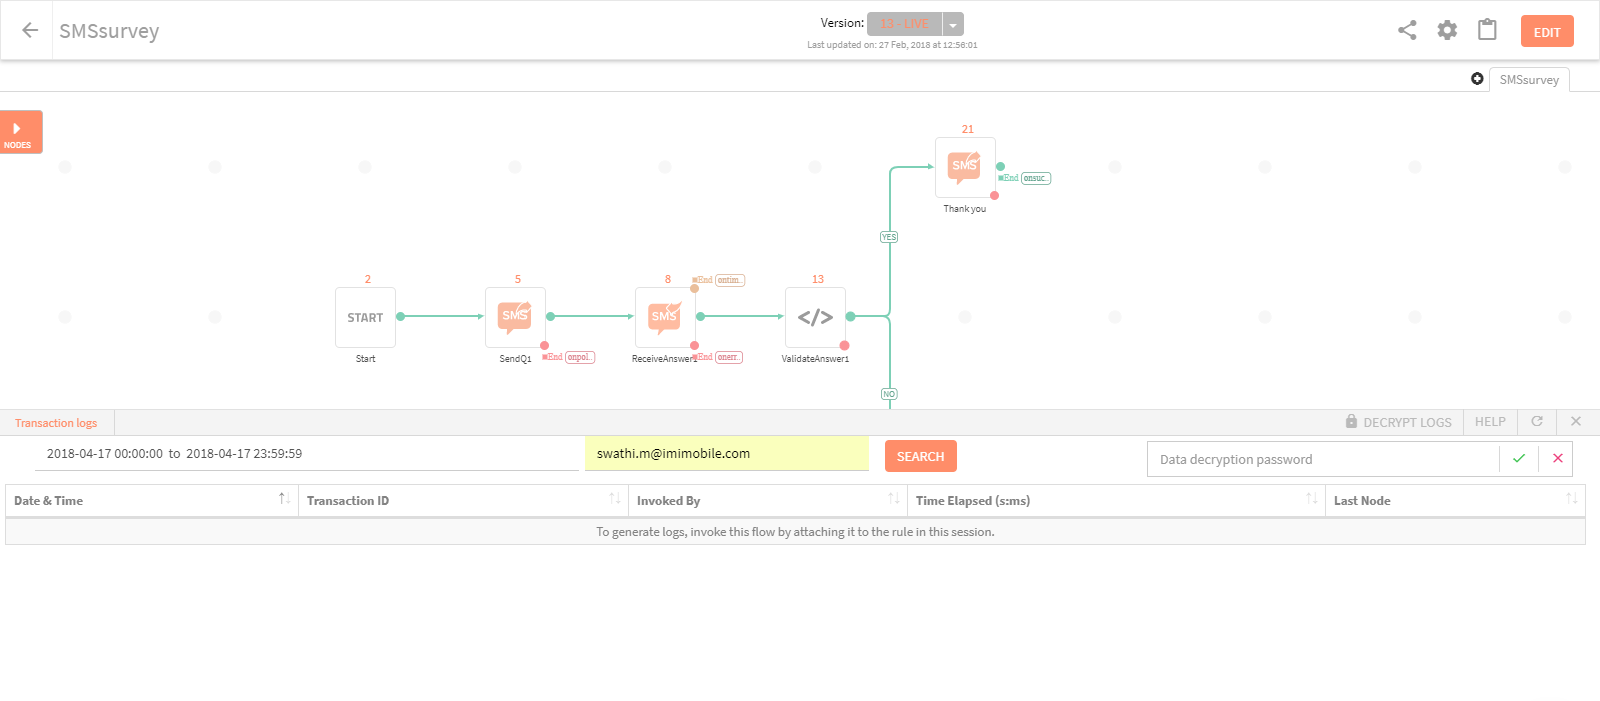
The debug screen appears split view mode (two halves screens), the upper part contains the Flow with each Node assigned a number. The lower section of the screen presents the Transaction Details of the Flow.
Start Debug activity
Debug functionality lists the events that took place while the flow was executed. Debug helps to view transaction details of the Flow and activity particulars of each Node. Using Debug you can view and ensure that the flow meets the goals it is designed for.
| Feature | Description |
|---|---|
| Transaction logs | The details below this heading are of Transactions log. |
| DECRYPT LOGS | Provide a passcode to decrypt and view transaction details.Note: Encryption is enabled when the 'DEBUG LOGGING' option is enabled on the General setting page.Contact your IMIconnect admin for Decryption passcode. |
| Help | View information about Debug feature. |
| Refresh | Click to refresh the transaction log details. |
| Close(X ) | Click to close the split windows mode. |
| Date & Time | Date and Time of the Transaction ID. |
| Transaction ID | Transaction ID of the Flow, Click the transaction ID for a drill down node level details and the flow |
| Search | Search a particular transaction using 'Traansactional ID' or by choose a time stamp. |
| Invoked By | The Rule that invoked and started the Flow. |
| Time Elapsed(s:ms) | Total time taken to complete the Flow in ms/s |
| Laste Node | |
| Sort | sort icon s are availabe for each of the heading, click to sort the details of the column in ascending or decending order. |
View Debug logs
‘Transactional Logs’ are set of records that contain the sequence of all the activity related to the flows. The log records include details such as the timestamp, title, execution status as well as an option to view detailed log.
The most recent 10 transaction logs are displayed by default, however, you can use a timestamp to view transaction logs.
- Click the datestamp under Transaction Logs
- Select Custom Range button to define a datestamp, choose From and To dates from the calendar.
- Click Apply and search.
The Transaction IDs between the selected dates are displayed. - Click a Transaction ID to view additional details.
- The selected Transaction ID is displayed near the Transaction logs and is displayed in pink color. The table below details now display the details of the Transaction ID.
| Name | Description |
|---|---|
| Transaction ID | The Transaction ID generated when the flow was invoked by a Rule. |
| Flow Time Elapsed | Time required to complete the flow in millisecond or seconds |
| Invoked by | The rule that triggered the flow. |
| Sequence | The sequence of node in the flow. |
| Time Stamp | Execution date and time of the node. |
| Node ID - Label | Name and ID of the node in execution at a timestamp. |
| Time Elapsed | Response time to execute the Node. |
- Click a record to view the Flow sequence.
- Click |> to view the drill-down of the sequence.
To copy Data, click the clipboard icon next to available data. - Toggle |> to close the drill-down view.
When you click on the Transaction ID records in the table, you will notice that the corresponding Node is selected in the other pane.
You can sort the Time Stamp and Node ID by clicking the icons next to it.
Use F12 function key to toggle between full screen and split screen.
Updated about 3 years ago